Skip to content
Home
About
Headteacher’s Welcome
Our Values
Our Staff
Cumbria Education Trust
Local Advisory Board
News
Key Info
Admissions
Assessment Results
DFE Schools Performance Tables
Financial Information
Ofsted
Policies
Pupil Premium
Safeguarding
Special Educational Needs
Sports Premium
Curriculum
Parents
Breakfast Club
CET Newsletters
Communication
Helpful Links
Lunchtime Arrangements
Privacy Notice
School hours
Uniform
Term Dates
Classes
Welcome to The Titanic Class
Welcome to Bismarck Class
Welcome to Cutty Sark Class
Vacancies
Vacancies
Train to Teach
Contact Us
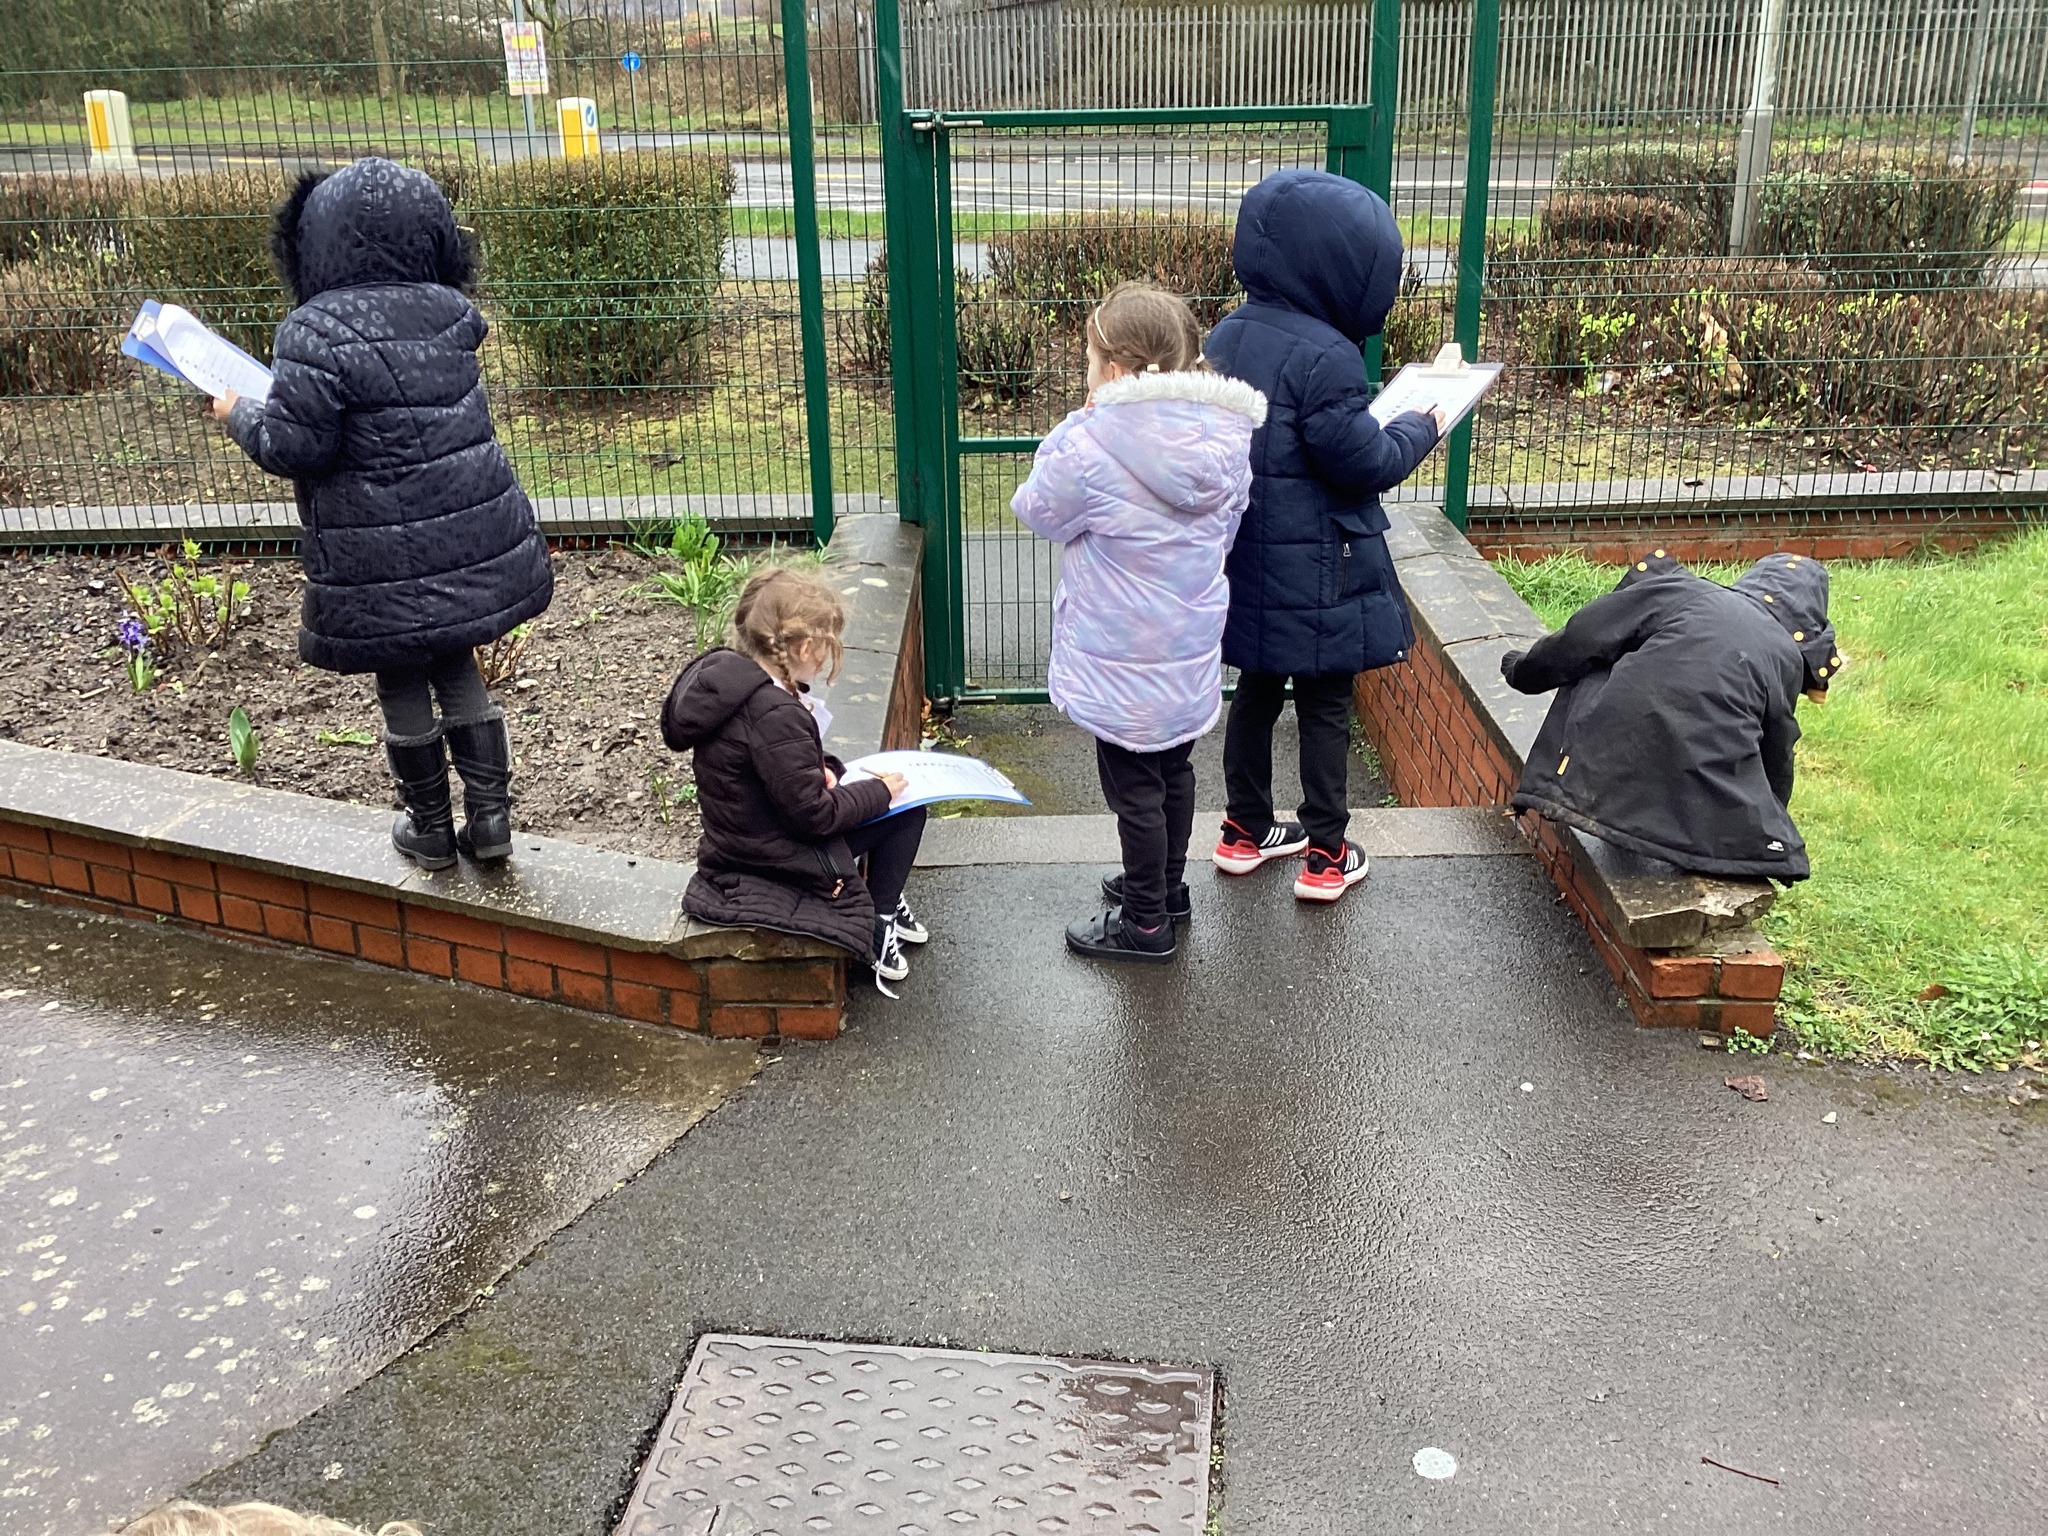
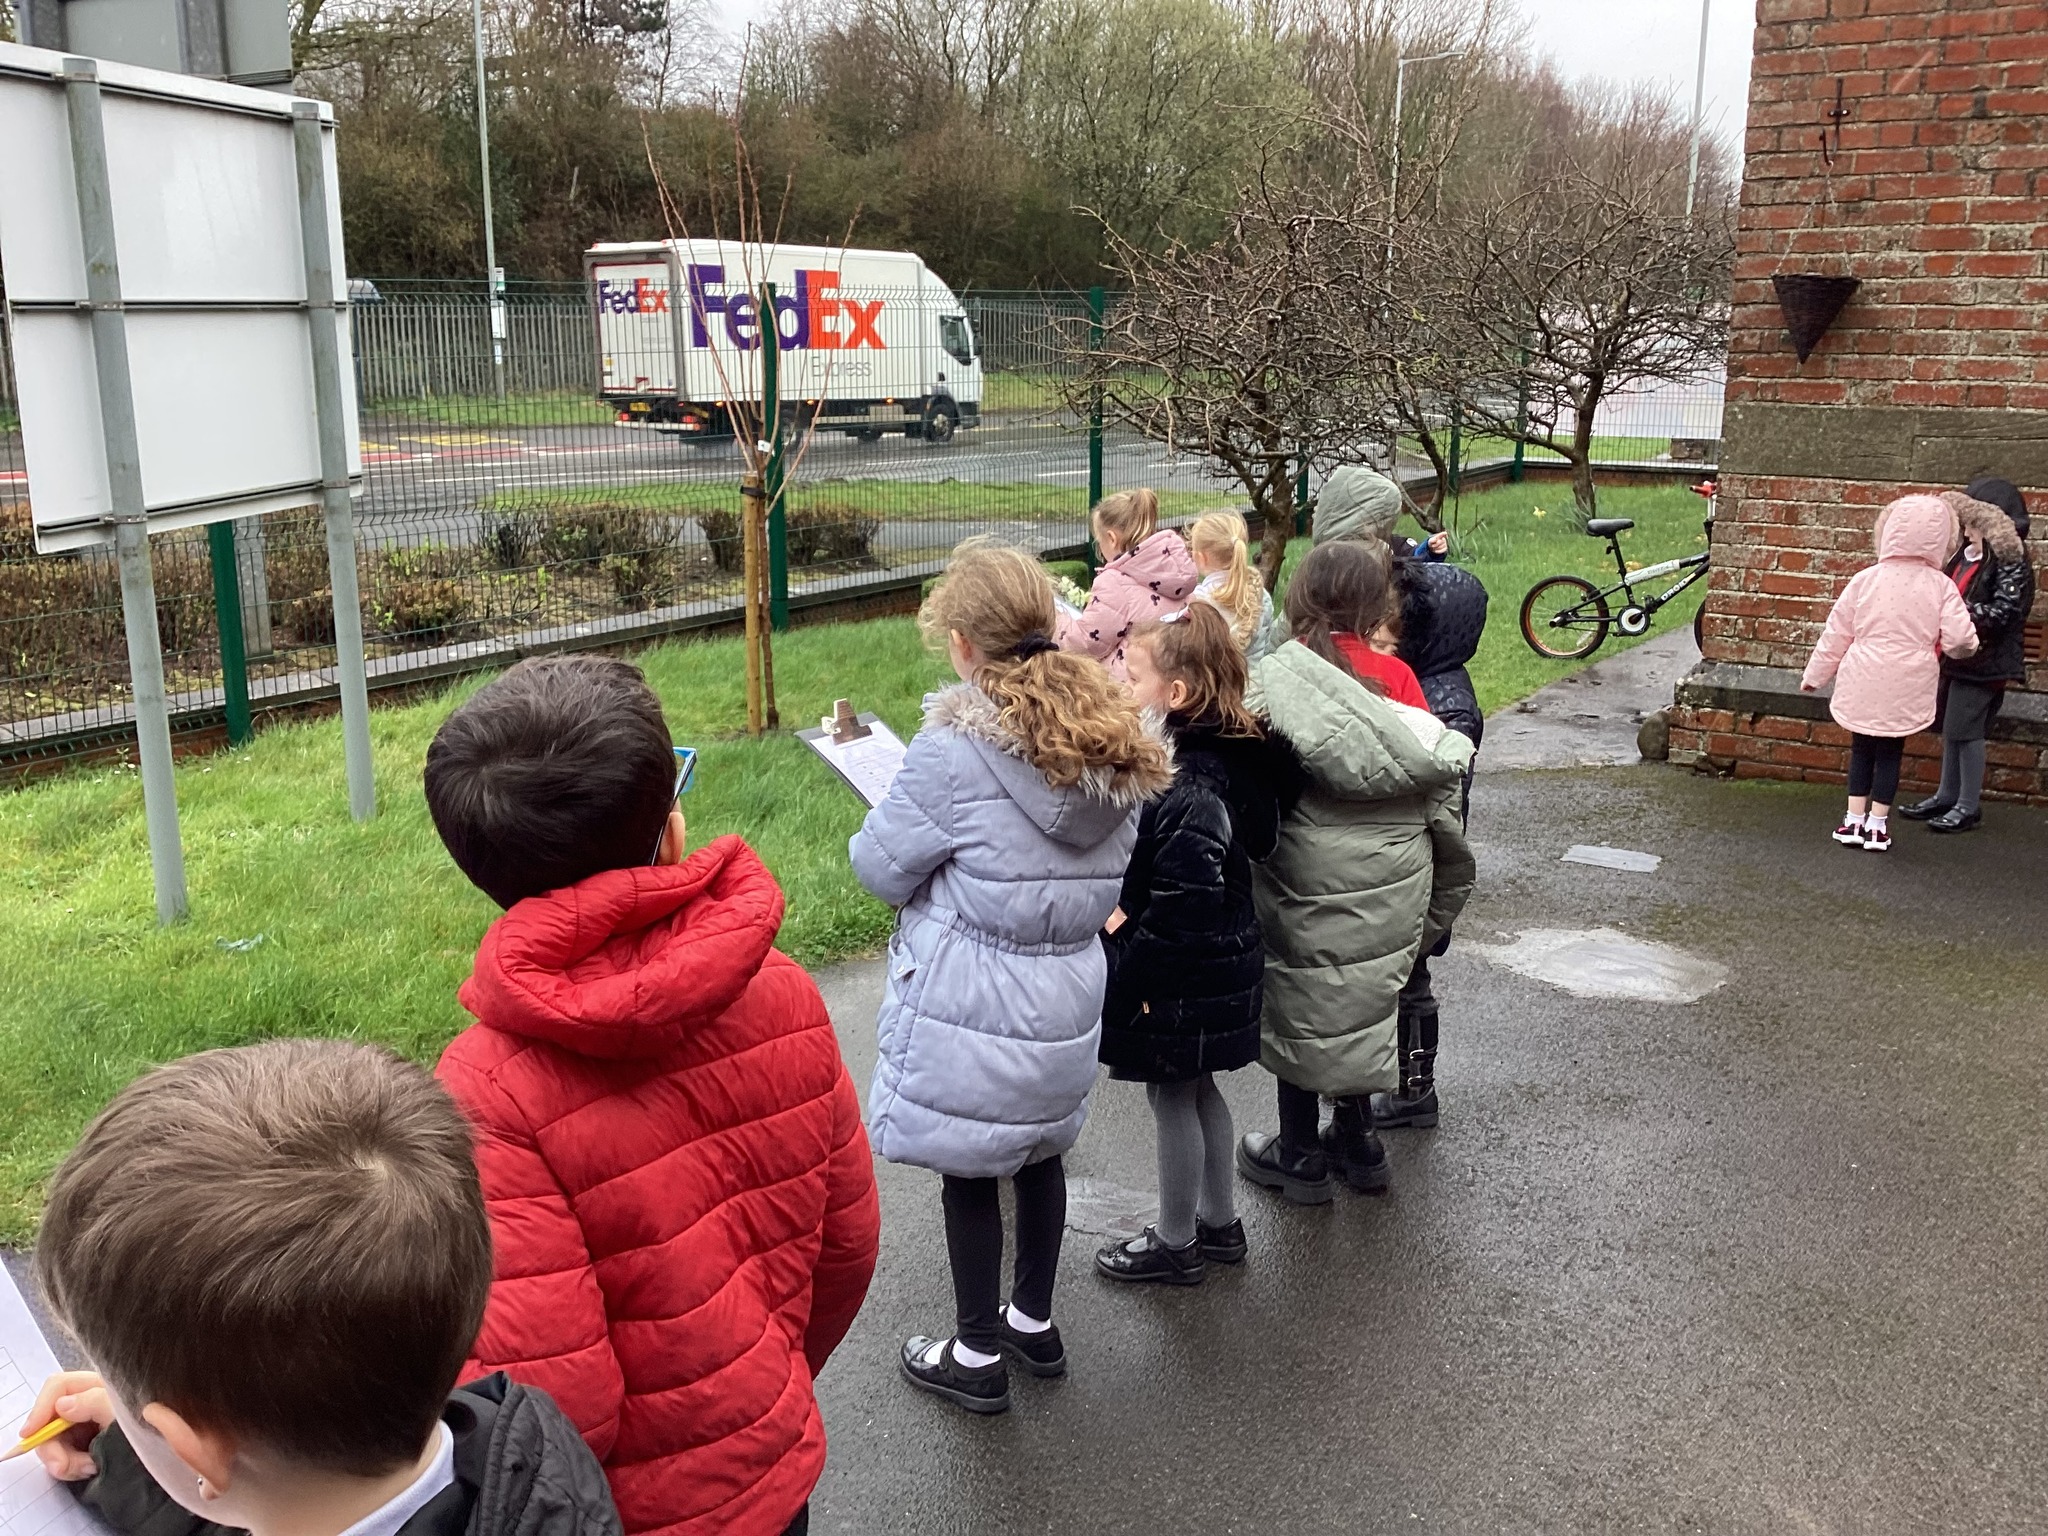
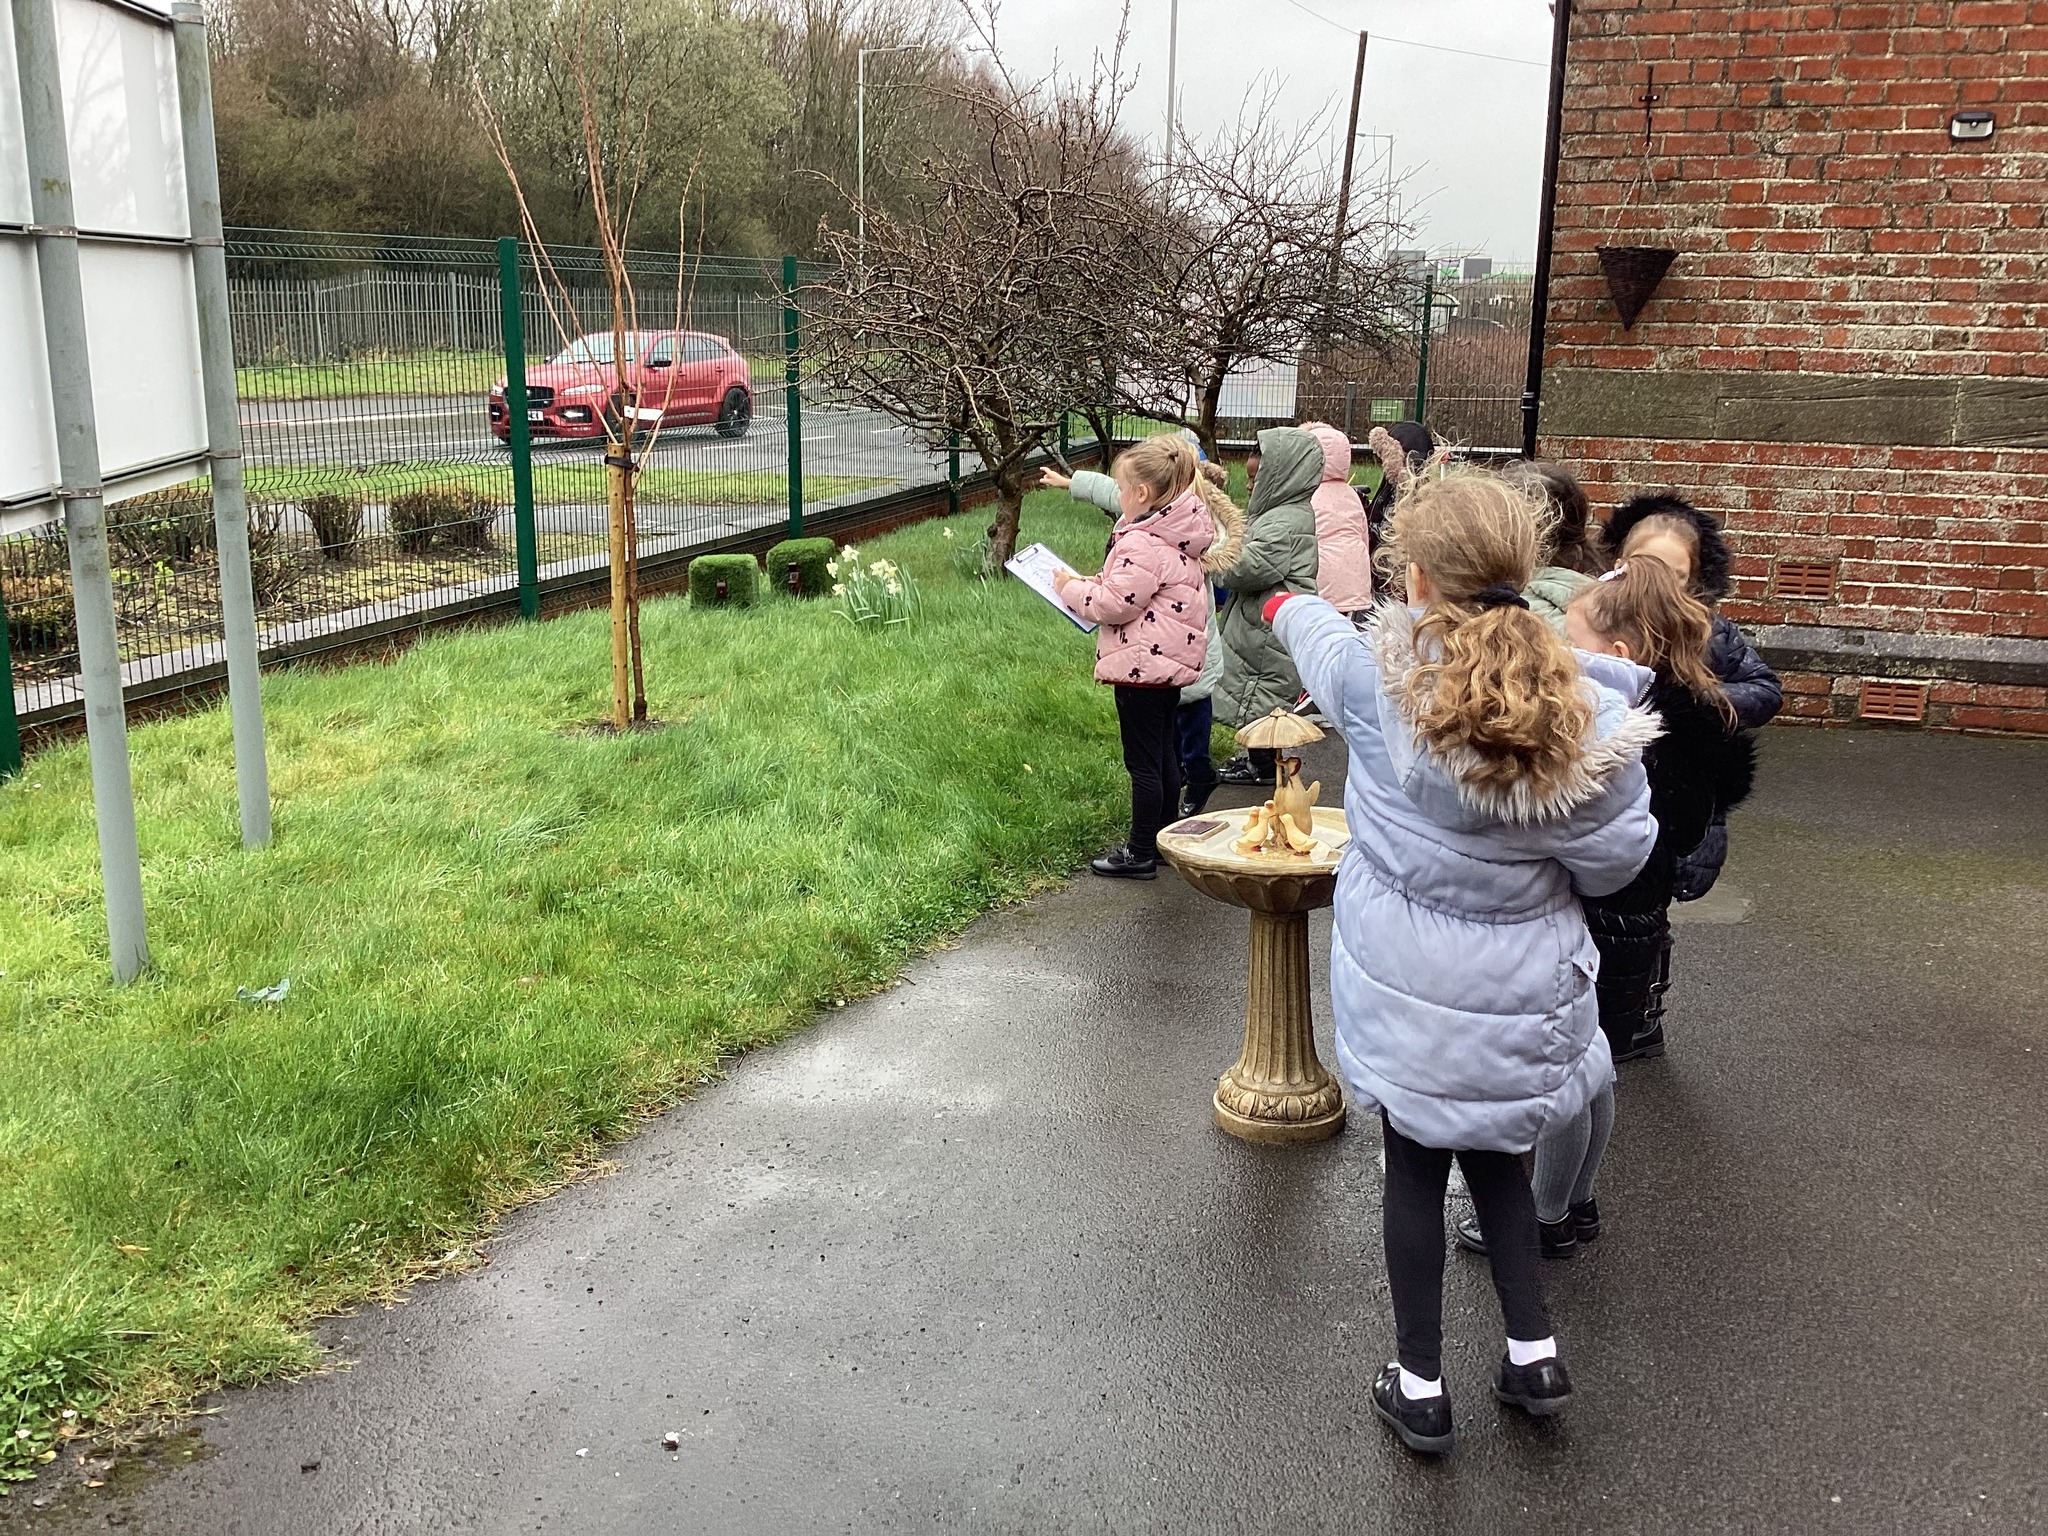
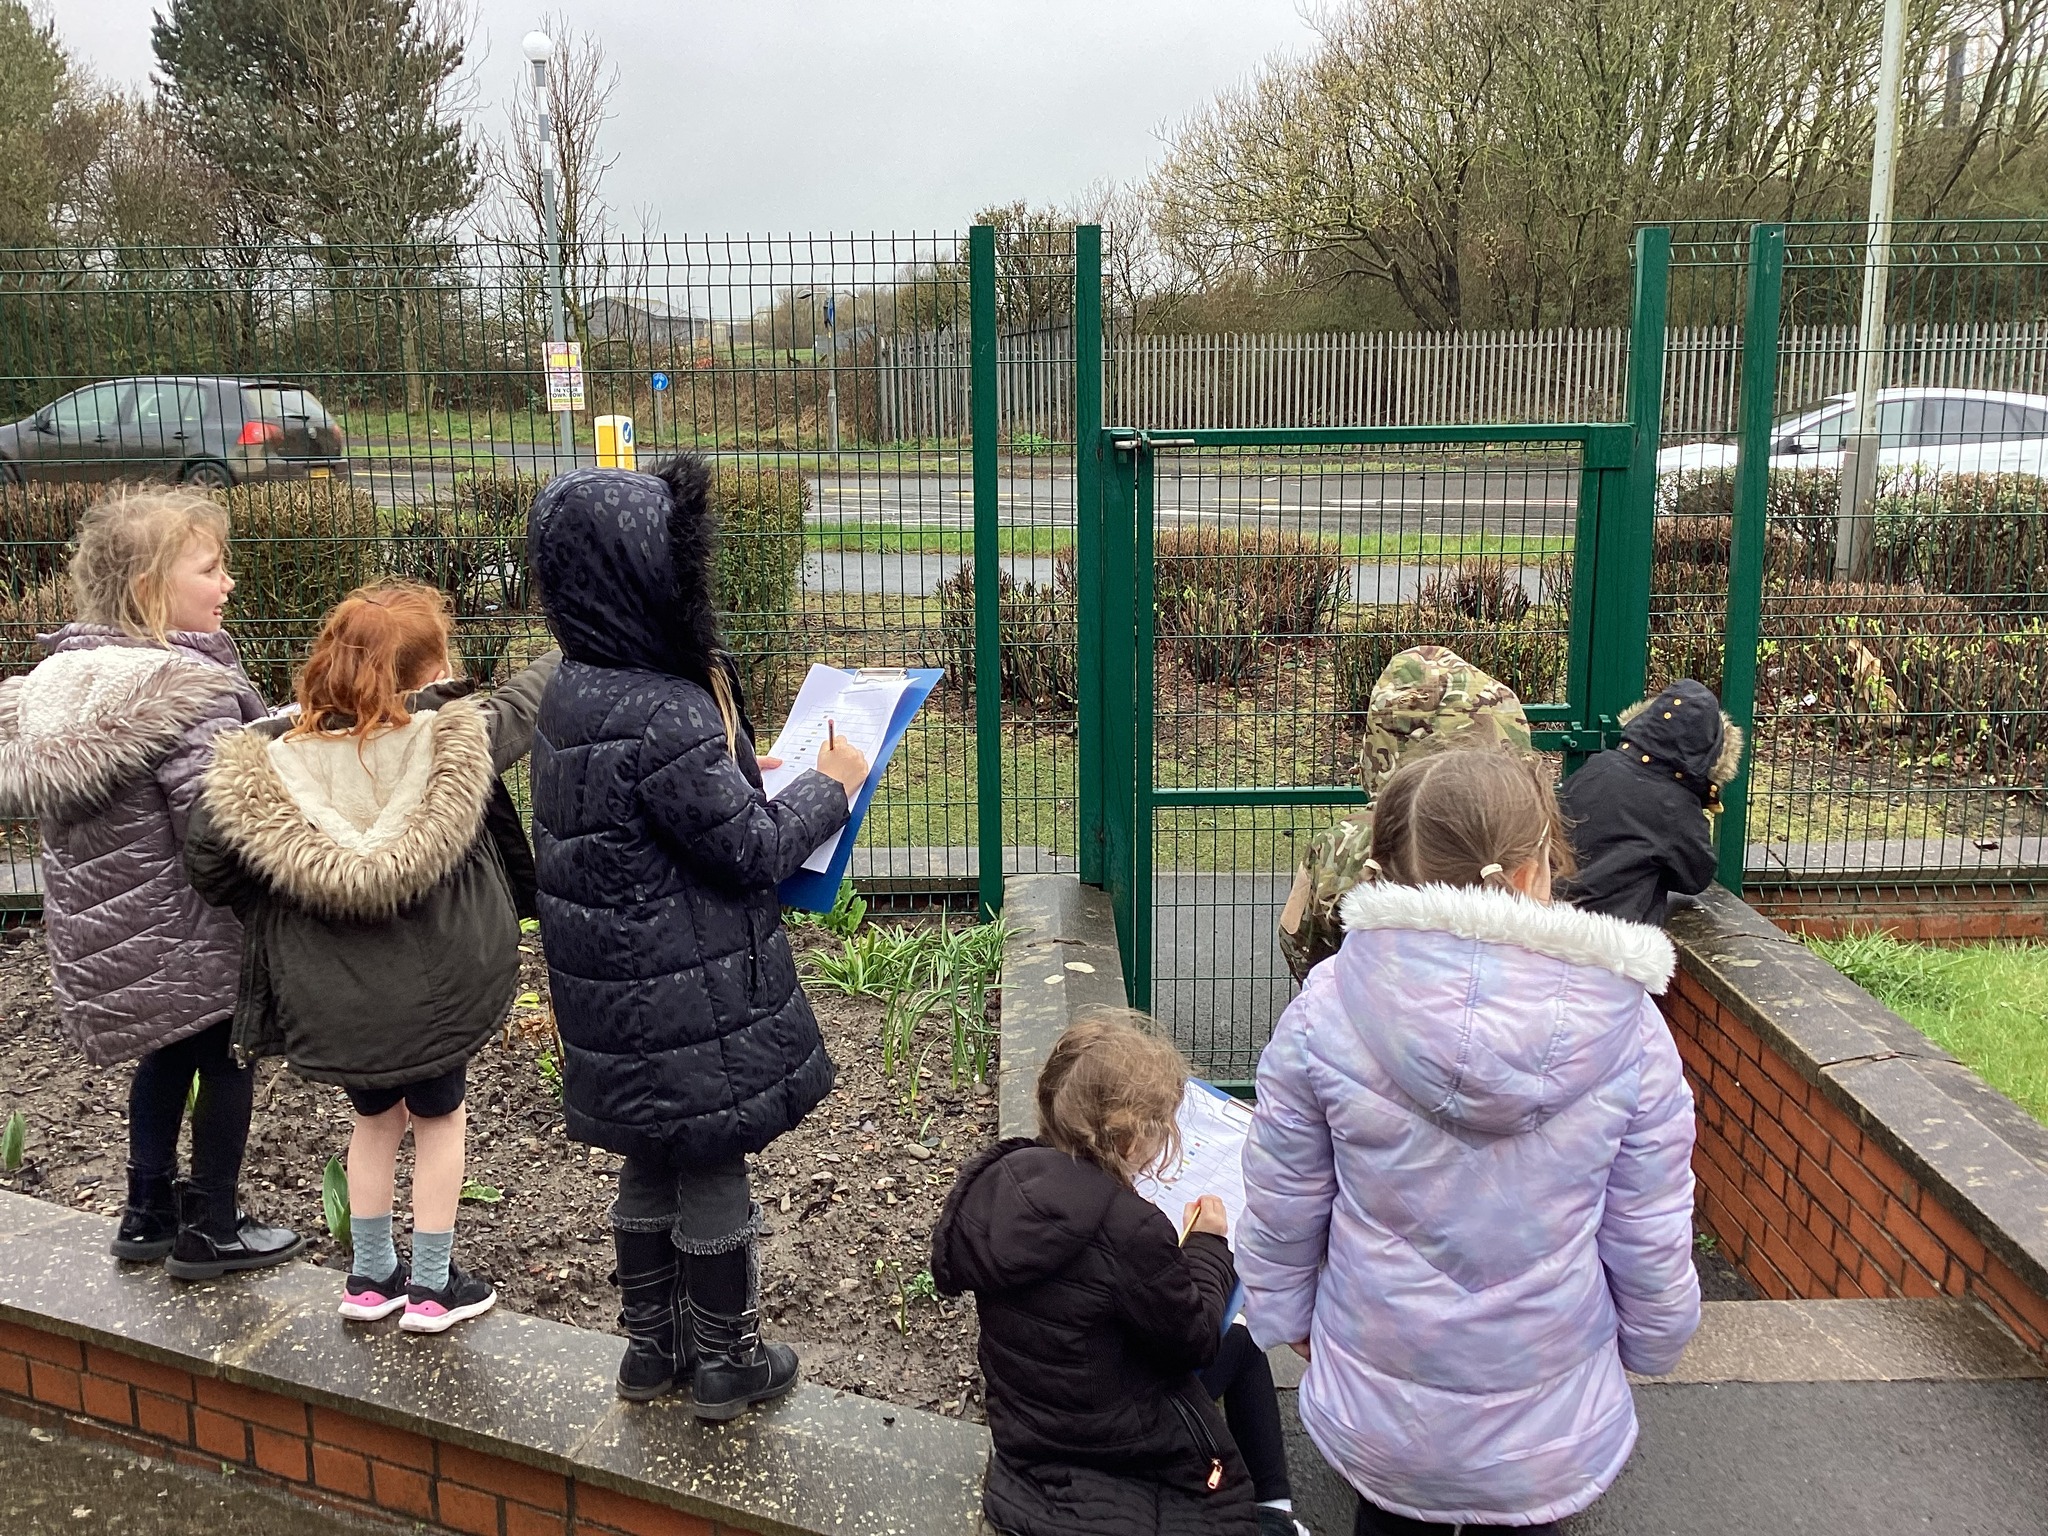
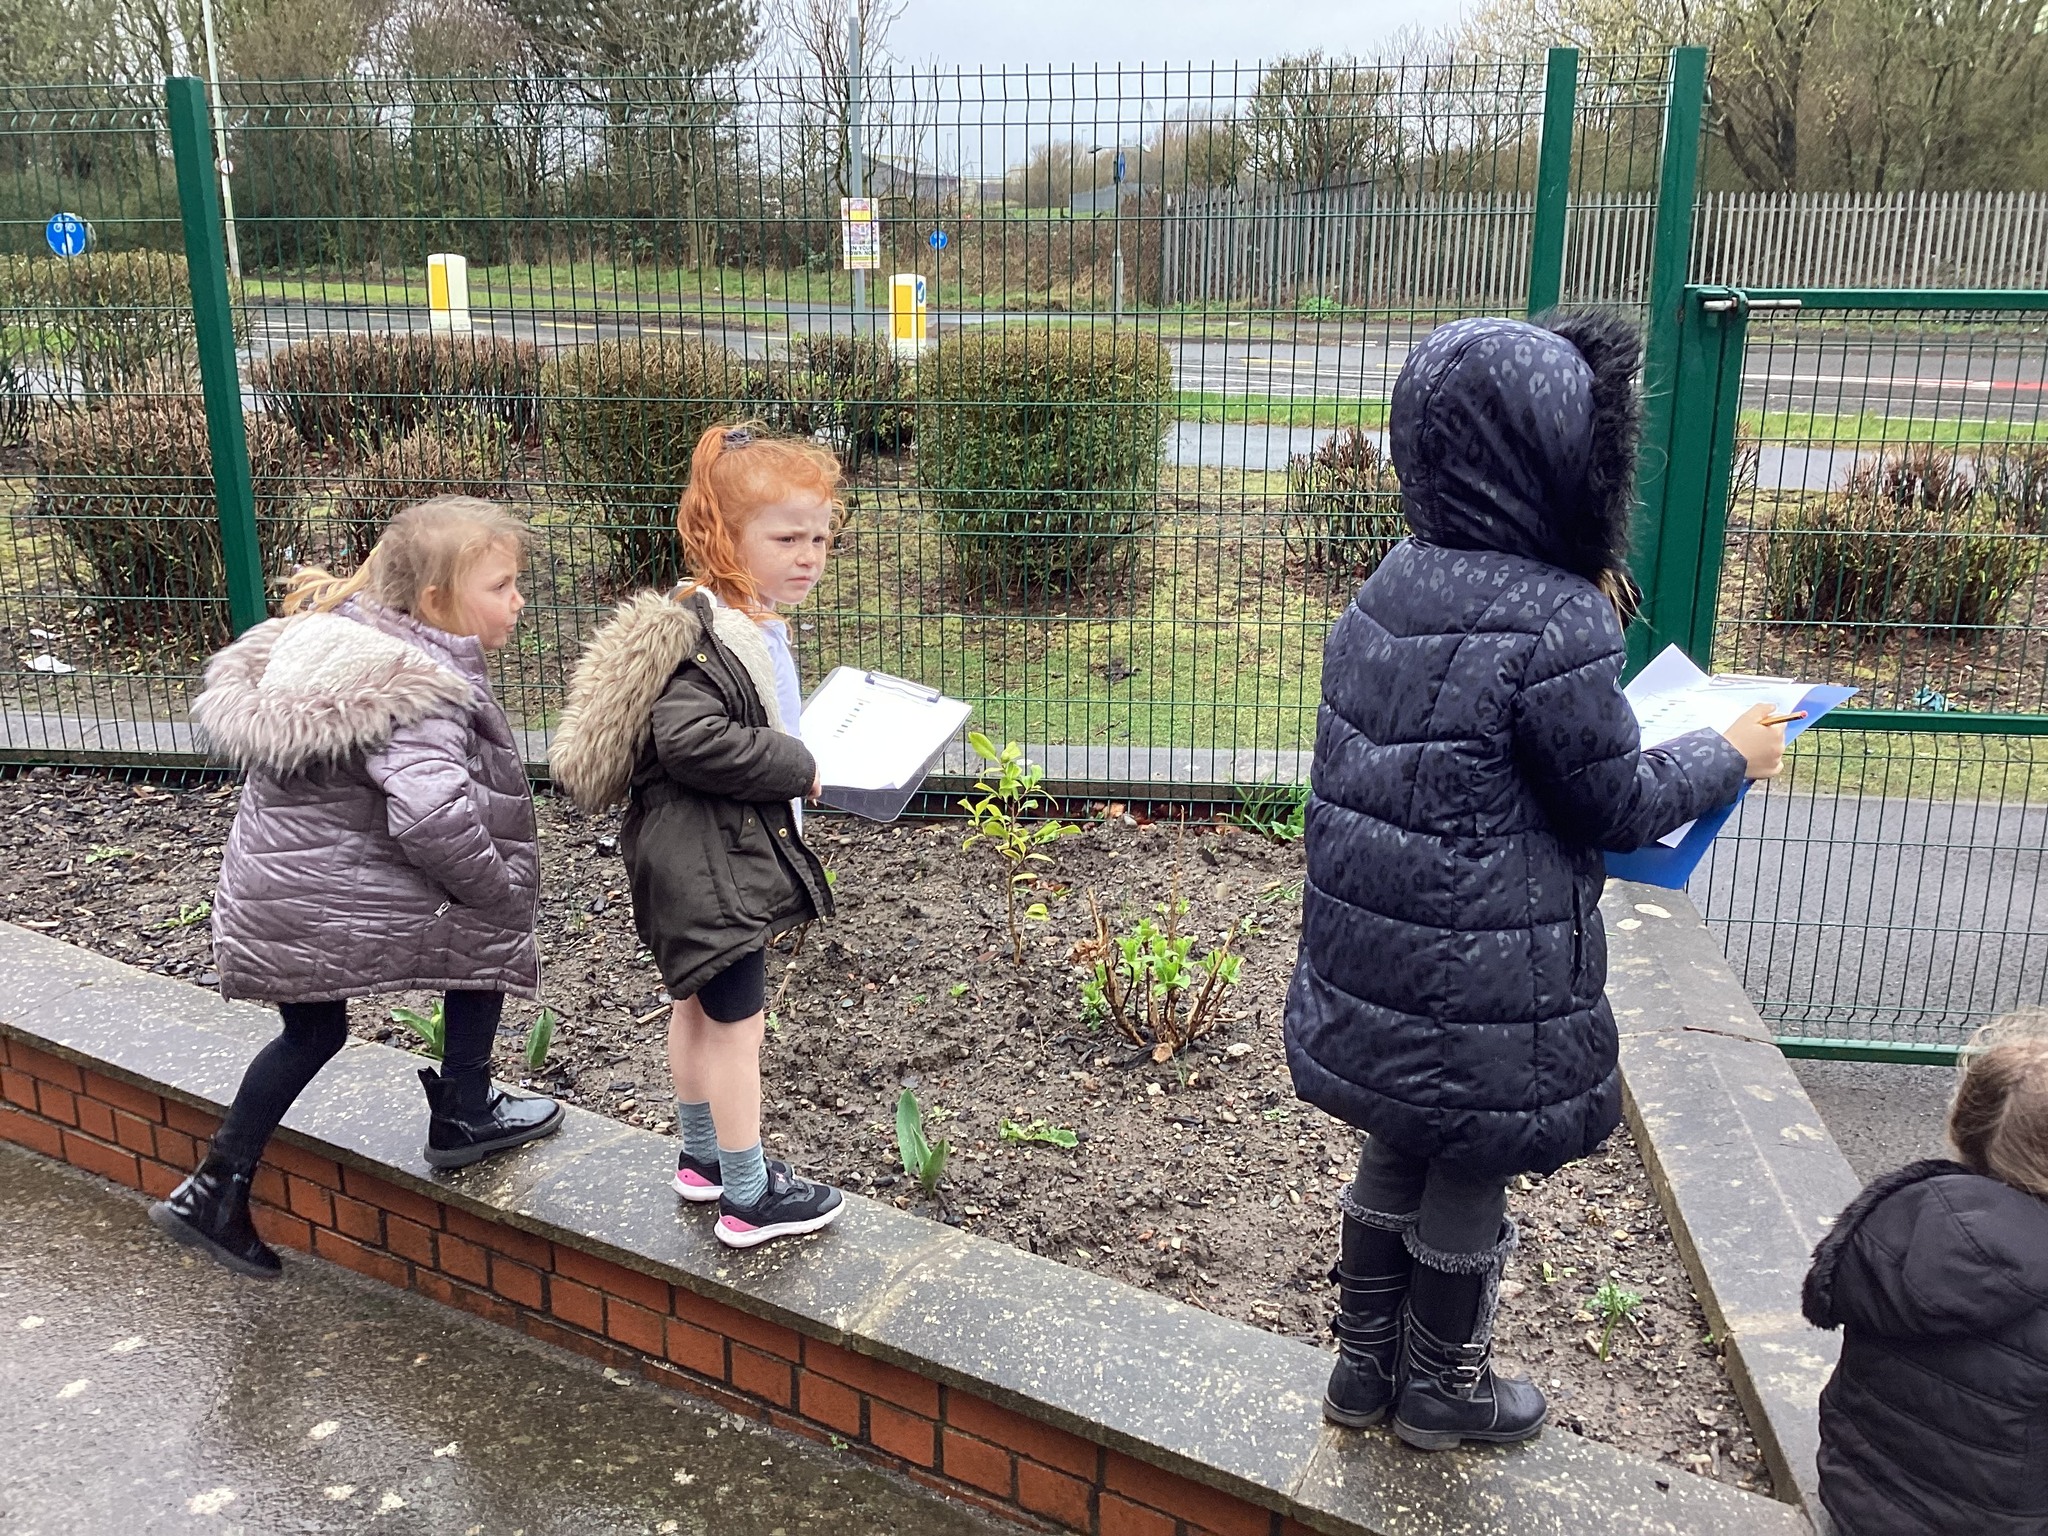
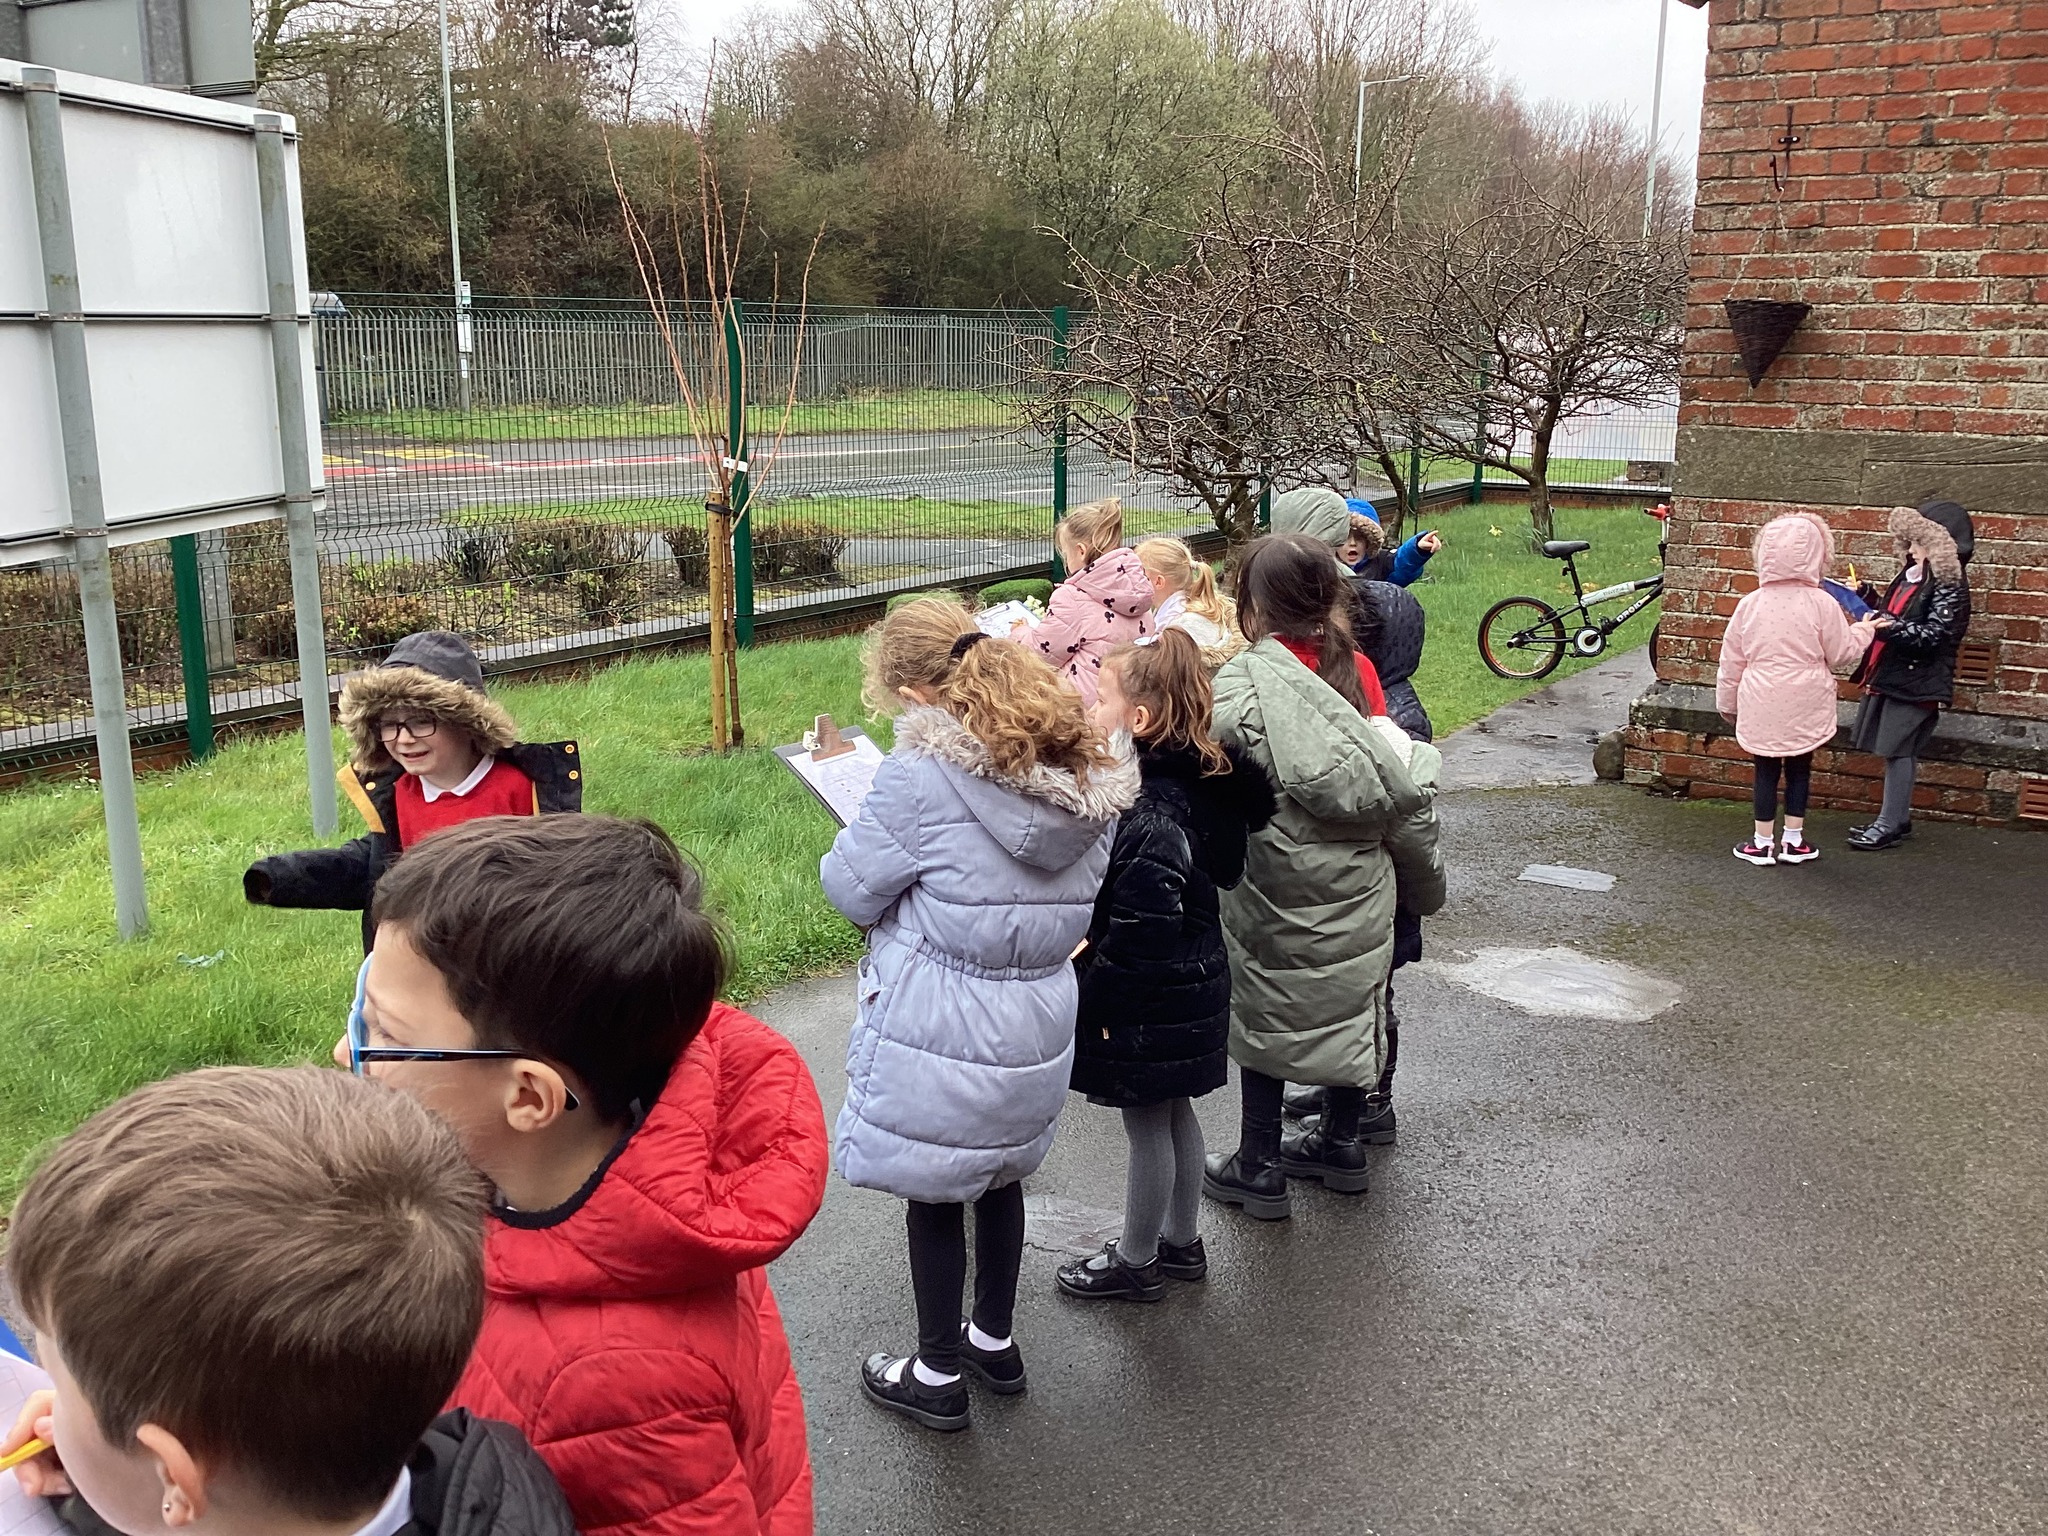
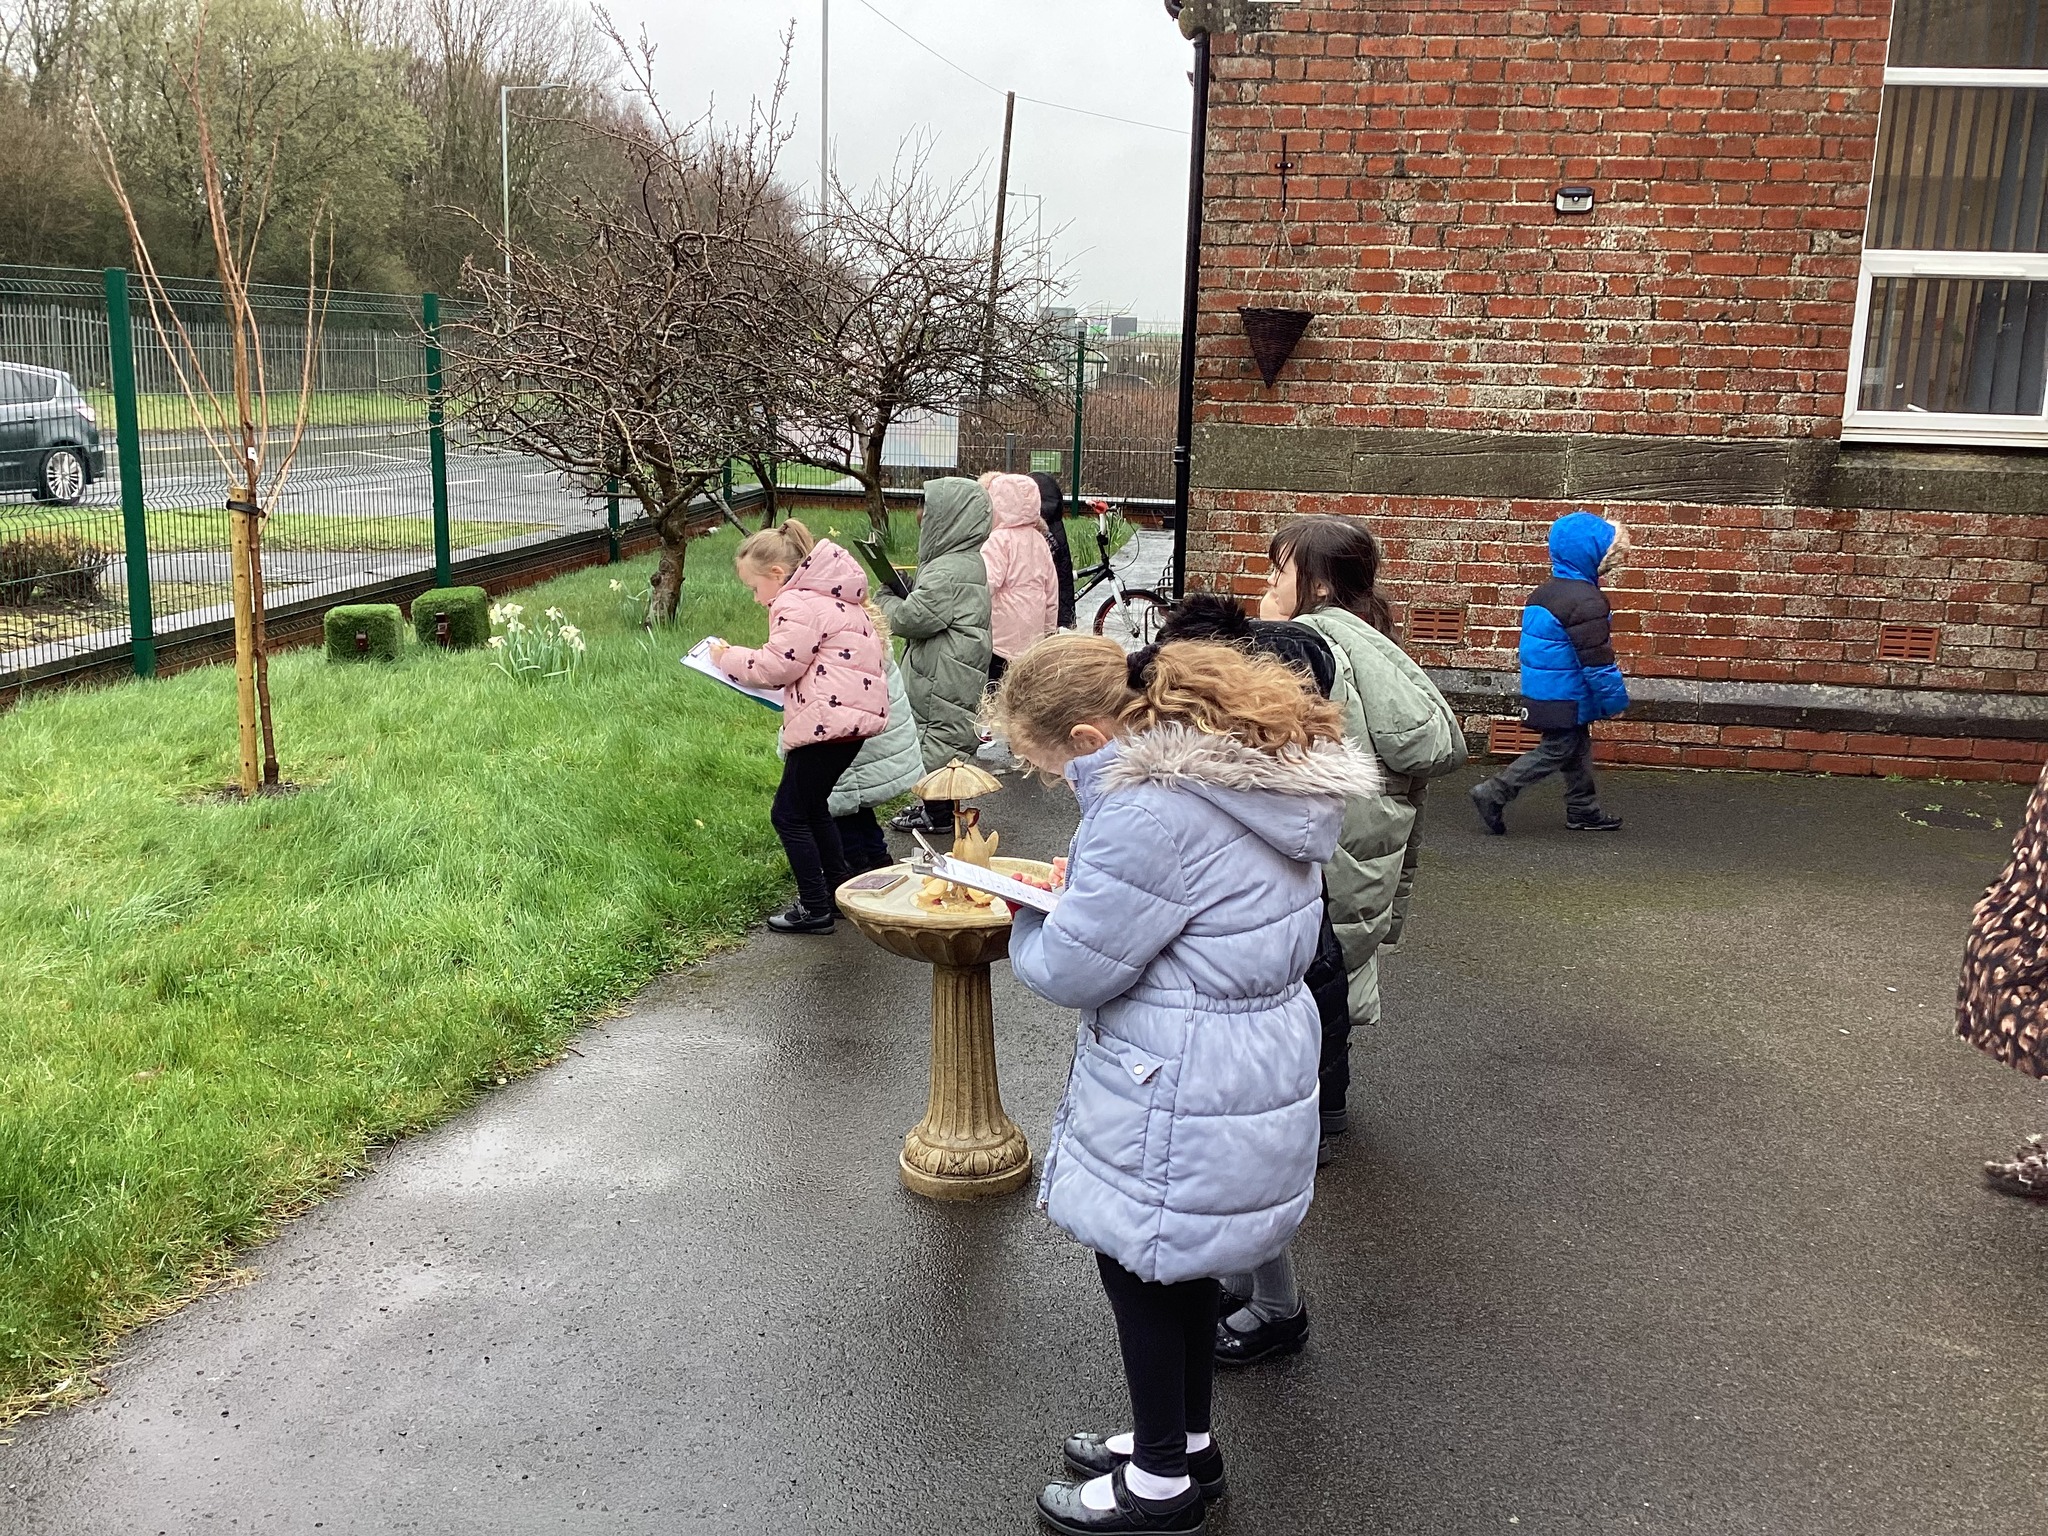
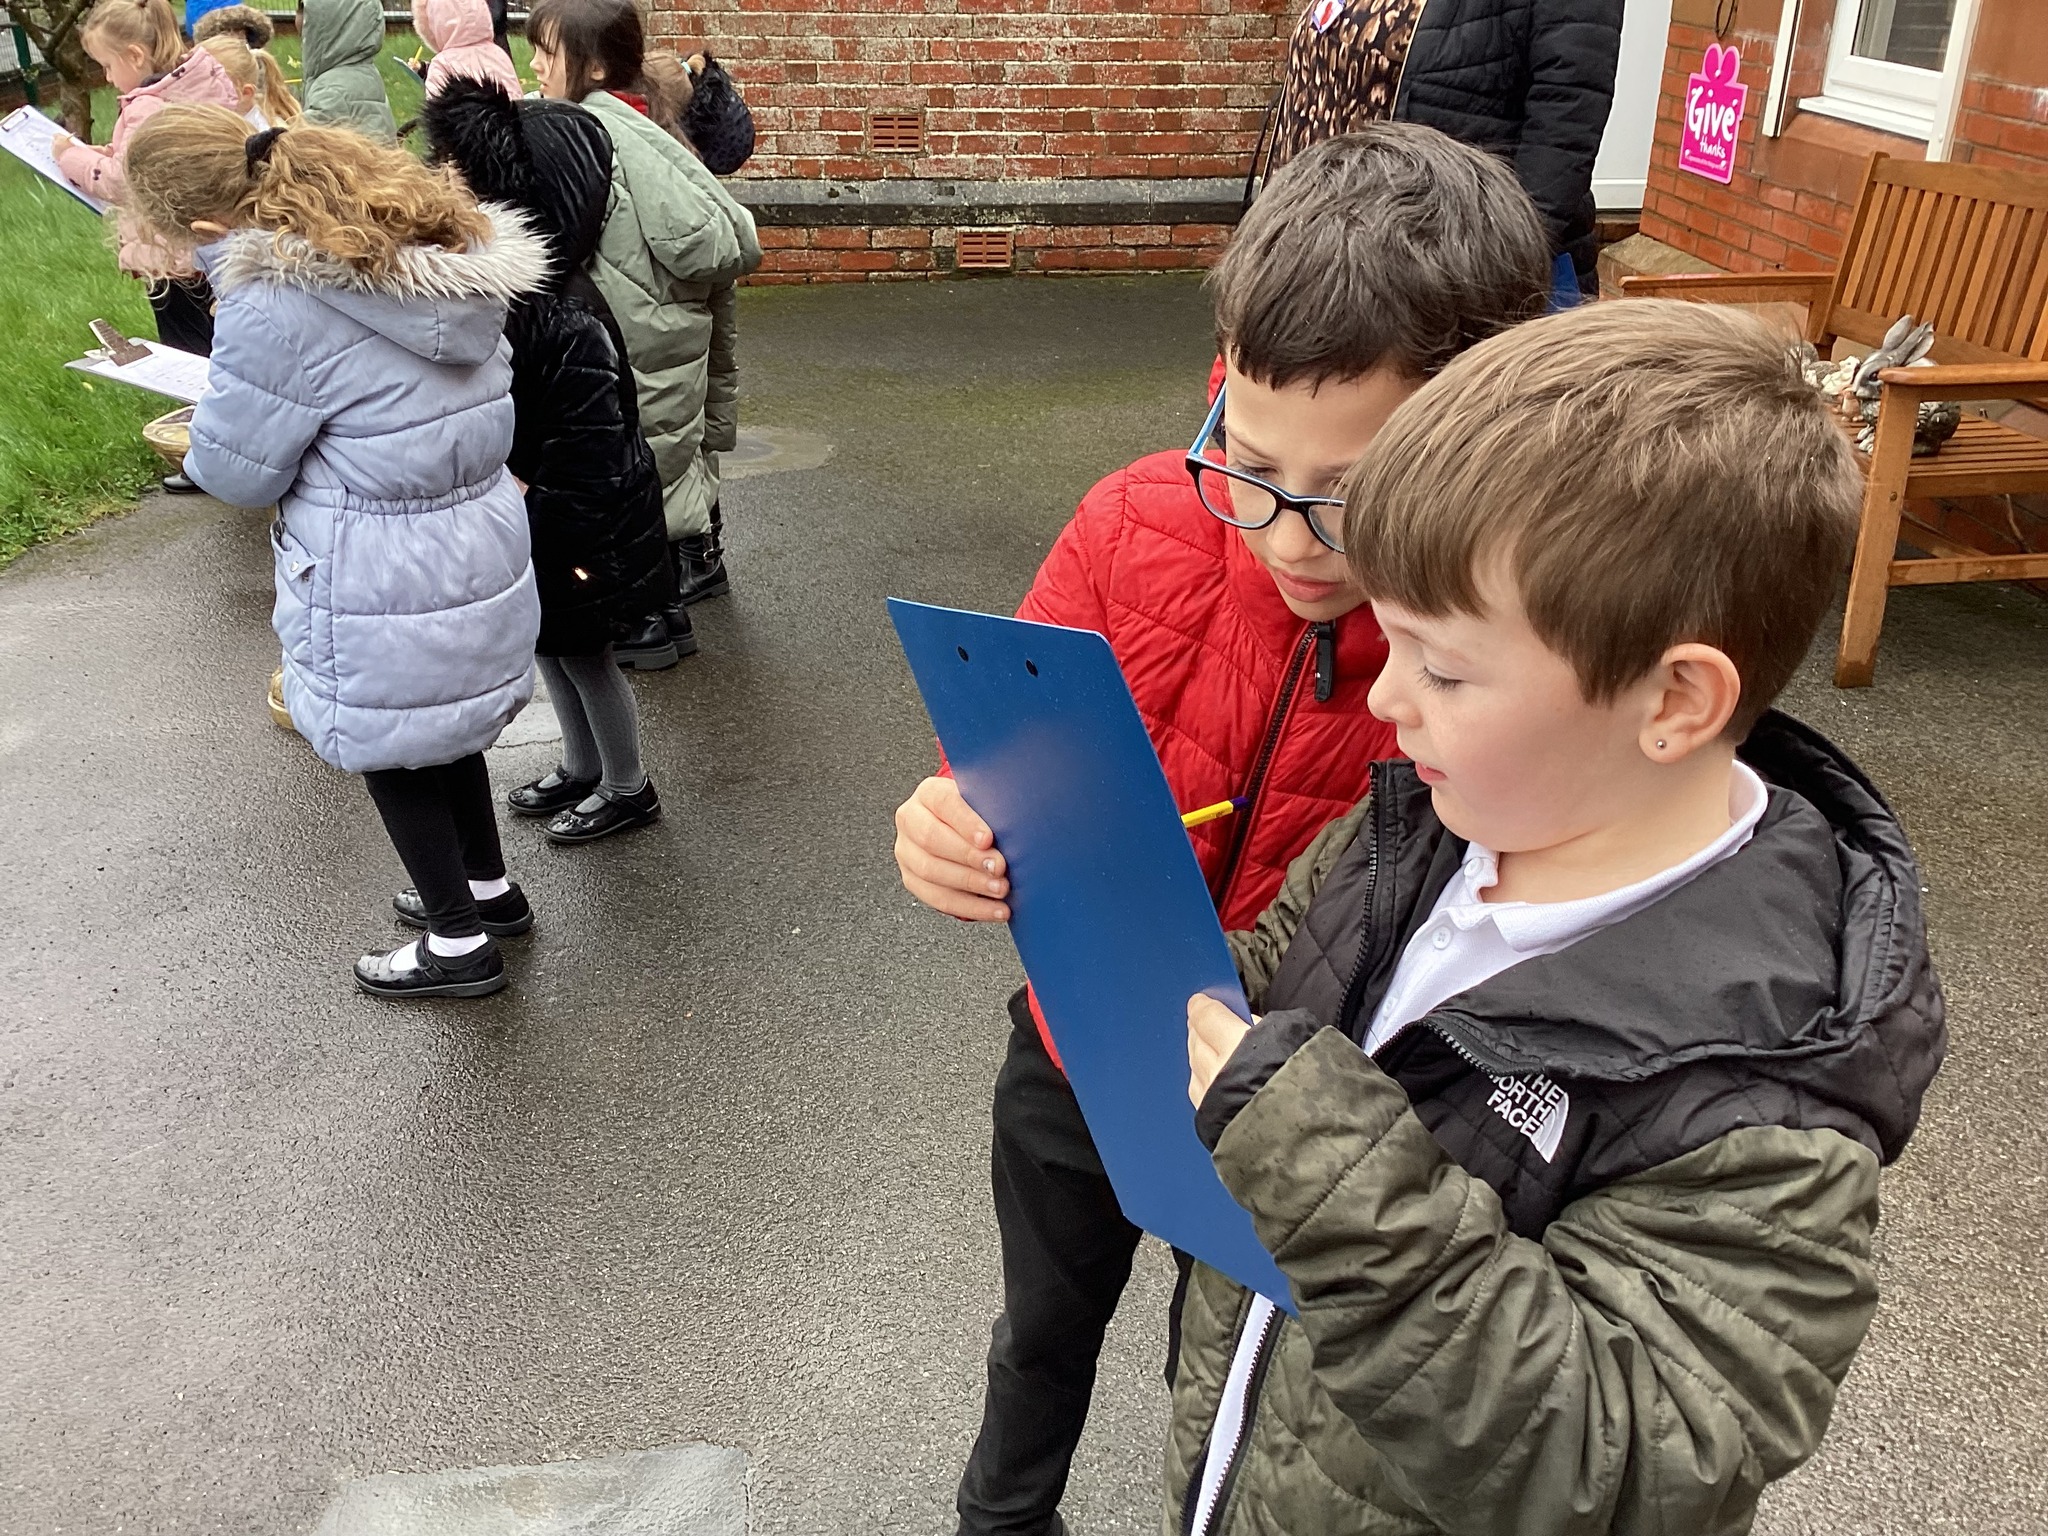
CLASS 2 – REPRESENTING DATA
Class 2 children have been looking at different ways to represent data for their ICT lessons.
Using the area at the front of our school, children collected data from counting the numbers of cars, grouped by colour.
Children then put this information into a tally to then create a bar chart to show this
News
March 25, 2024
2:09 pm
Share this post
Facebook
WhatsApp
LinkedIn
Email
Print